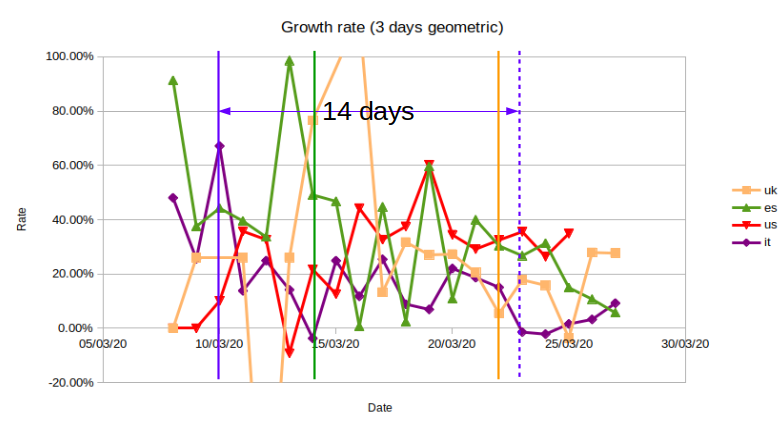
Evidence of effectiveness of lock-down measures – 27-Mar-2020
The picture below shows the dynamic of the daily growth’s rate of fatalities in four different countries up to the 27th March 20202: Italy (purple), Spain (green), United Kingdom (orange) and United States (red). The choice and methodology of these statistics has been described in an introductory post. The vertical lines with the respective colours indicate the dates when a full country lock-down was sanctioned by the different governments: 10th March for Italy, 15th March for Spain and 23rd March for the UK. When considering a lag of two to three weeks for the virus to result into a fatality, we can spot some positive signs of curve flattening in Italy and Spain, the first European countries to introduce such measures. Even if the daily death rate in Italy and Spain is much higher than the United Kingdom and the US, there is a clear sign that their curves are peaking, and of the effectiveness of a full country lock-down.

Italy’s curve statistics are currently showing some reversal of trend. Time will tell if this is a real or temporary worsening of the infection in this country.
Recent Comments