A forecasting approach for the UK curve
With this post I will try a simple forecast of the UK curve under some strong assumptions:
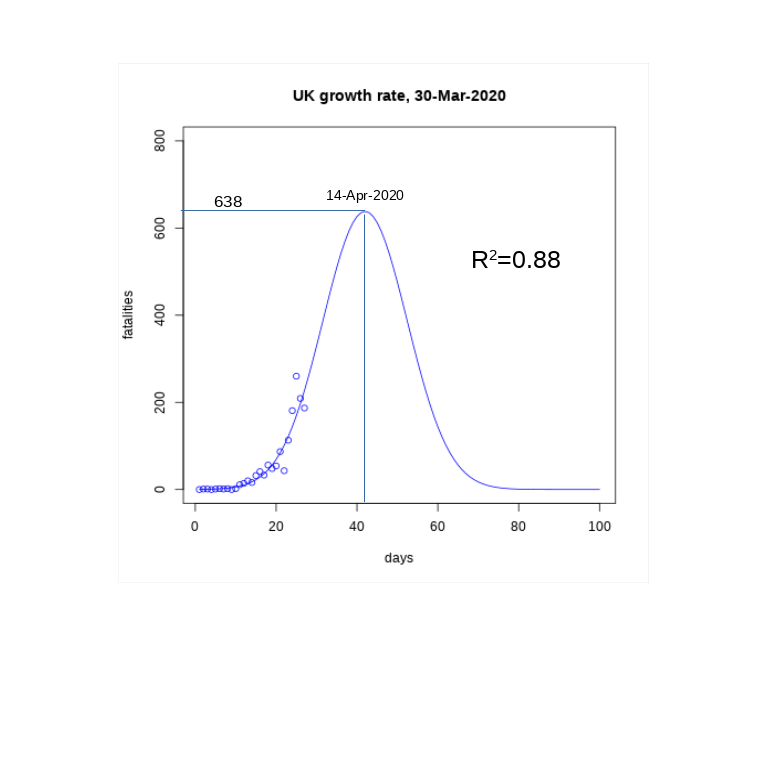
- The daily fatality rate follows a Gaussian-like function, with formula r(d) = M*exp(-alpha*(d-p)^2), with three parameters to be fitted: the scale M, the peak position p and the speed alpha.
- The model has reached equilibrium: this is after the government has taken some actions and those actions are not changed in the course of time
- The peak position p, crucial for this modelling, is placed around three weeks after the beginning of the country lock-down. The UK lock-down started on the 23rd March (day 23 in my series) and I am thus centring the peak position on the 14th April (day 42). Sliding this peak position has a significant effect, and can be used for best to worst scenarios estimations.
- M and alpha are regressed by using the logarithm of the rate as the dependent variable and z = (d-p)^2 as the independent one.
Let’s explain the last point about the regression technique by taking the log of r(d):
y(d) = log(r(d)) = log(M) -alpha*(d-p)^2 = C – alpha*z
By regressing the daily logarithm of the growth rate against z, one can find the intercept C, and hence M=exp(C) and alpha. By sliding the peak p, different regression can be performed with different peak positions.
An example can be seen in the curve here, with peak set to the 14th of April: The solid line represents the model and the circles points the data available so far. By integrating the area under the curve we can easily estimate the total number of fatalities in the UK to about 17000. However moving the peak to an earlier day greatly reduces the number of fatalities: when the peak is around day 34 (6th April), the total number of fatalities drops to about 6000. Overall I would say that the current data is compatible with a curve peaking in beginning to mid-April and with total number of fatalities in the 5000–20000 range.
Recent Comments